In this article, I will show you how to work with 3D plots in Matplotlib. Specifically, we will be making a 3D line plot and surface plot.
First, import matplotlib and numpy. %matplotlib inline just sets the backend of matplotlib to the ‘inline’ backend, so the output of plotting commands shows inline (directly below the code cell that produced it).
import matplotlib.pyplot as plt
import numpy as np

%matplotlib inline
Add this import statement to work with 3D axes in matplotlib:
from mpl_toolkits.mplot3d.axes3d import Axes3D
Now, let’s generate an empty 3D plot
fig = plt.figure()
ax = plt.axes(projection='3d')

plt.show()

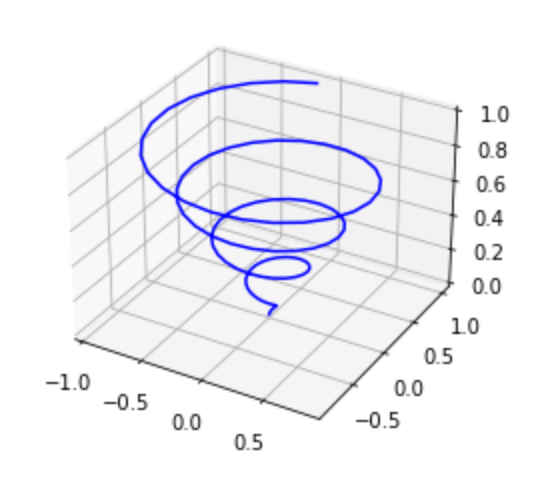
3-D Line Plot
Now, it’s time to put a graph on the plot. We’ll start by making a 3D line plot.
We need to define values for all 3 axes:
z = np.linspace(0, 1, 100)
x = z * np.sin(25 * z)
y = z * np.cos(25 * z)
If we print out the shape of the arrays we just created, we’ll see that they are one-dimensional arrays.
>>> print('Z Array: ', z.shape)
Z Array:  (100,)
This is important because the plot3D function only accepts 1D arrays as inputs. Now, we can add the plot!
ax.plot3D(x, y, z, 'blue')

plt.show()
Final code:
import matplotlib.pyplot as plt
import numpy as np
from mpl_toolkits.mplot3d.axes3d import Axes3D
%matplotlib inline

fig = plt.figure()
ax = plt.axes(projection='3d')

z = np.linspace(0, 1, 100)
x = z * np.sin(25 * z)
y = z * np.cos(25 * z)

ax.plot3D(x, y, z, 'blue')

plt.show()
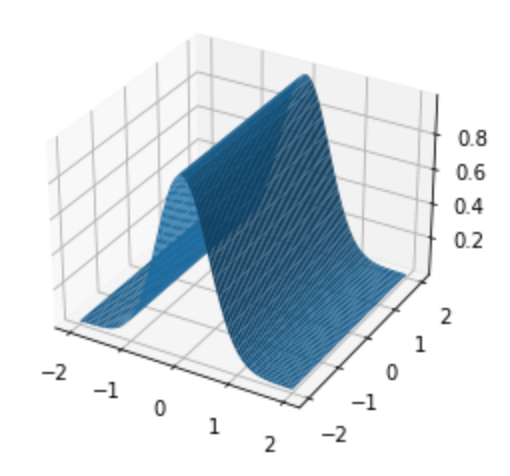
3-D Surface Plot
Now, we will make a 3D surface graph on the plot.
We need to define values for all 3 axes:
x = np.linspace(start=-2, stop=2, num=200)
y = x_4.copy().T
z = 3**(-x_4**2-y_4**2)
The x, y, z arrays we just created are all 1D arrays. The surface plot function requires 2D array inputs so we need to convert the numpy arrays to be 2D. We can use the reshape function for this.
x = np.reshape(x,(1, x.size))
y = np.reshape(y,(1, y.size))
z = np.reshape(z,(1, z.size))
So now if we print our arrays, we see that they’re 2D.
>>> print('X Array: ', x.shape)
X Array:  (200, 200)
Now, we can plot the surface graph!
ax.plot_surface(x, y, z)

plt.show()
Final code:
import matplotlib.pyplot as plt
import numpy as np
from mpl_toolkits.mplot3d.axes3d import Axes3D
%matplotlib inline

fig = plt.figure()
ax = plt.axes(projection='3d')

x = np.linspace(start=-2, stop=2, num=200)
y = x_4.copy().T
z = 3**(-x_4**2-y_4**2)

x = np.reshape(x,(1, x.size))
y = np.reshape(y,(1, y.size))
z = np.reshape(z,(1, z.size))

ax.plot_surface(x, y, z)

plt.show()
We can also add a title and axis labels to the graph:
ax.set_title('My Graph')

ax.set_xlabel('X', fontsize=20)
ax.set_ylabel('Y', fontsize=20)
ax.set_zlabel('Z', fontsize=20)
This is just a basic intro to 3D charting with Matplotlib. There are a variety of other types of plots and customizations that you can make. Happy graphing!
