Get n-largest values from a particular column in Pandas DataFrame
df.nlargest(5, 'Gross')
Return the first n rows with the smallest values for column in DataFrame
df.nsmallest(5, ['Age'])
To order by the smallest values in column “Age” and then “Salary”, we can specify multiple columns like in the next example.
df.nsmallest(5, ['Age', 'Salary'])
There is also an optional keep parameter for the nlargest and nsmallest functions. keep has three possible values: {'first', 'last', 'all'}. The default is 'first'
Where there are duplicate values:
first : take the first occurrence.
last : take the last occurrence.
all : do not drop any duplicates, even it means selecting more than n items.
When you are working with a new Pandas DataFrame, these attributes and methods will give you insights into key aspects of the data.
The dir function let’s you look at all of the attributes that a Python object has.
dir(df)
The shape attribute returns a tuple of integers indicating the number of elements that are stored along each dimension of an array. For a 2D-array with N rows and M columns, shape will be (N,M).
df.shape
You may be working with a dataframe that has hundreds or thousands of rows. To get a glimpse of the data inside a dataframe without printing out all of the values you can use the head and tail methods.
Returns the first n rows in the dataframe
df.head() # returns rows 0-4
df.head(n) # returns the first n rows
Returns the last n rows in the dataframe
df.tail()
df.tail(n)
The count method of a dataframe shows you the number of entries for each column
df.count()
Check if there are any missing values in any of the columns
pd.isnull(df).any()
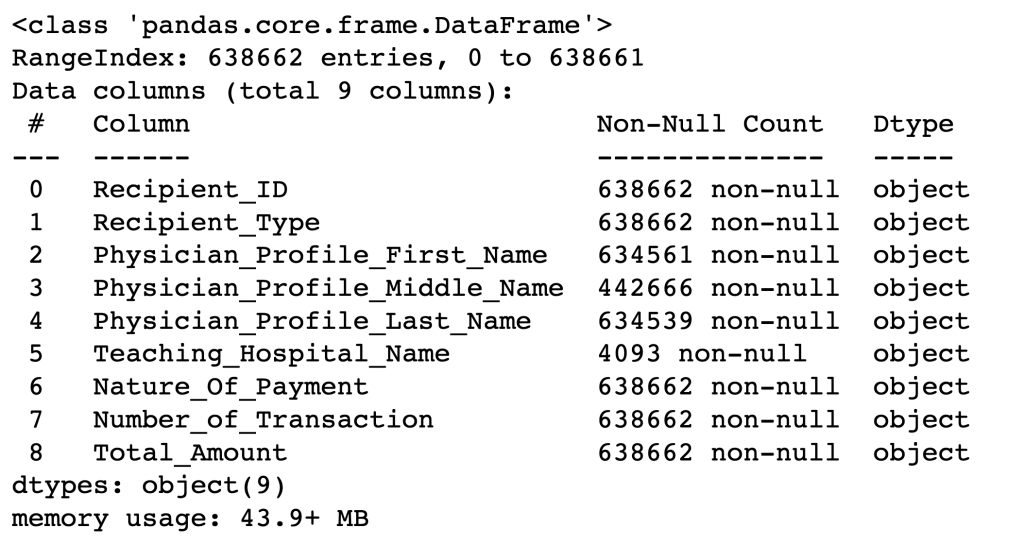
The info method of the dataframe gives a bunch of information. It tells
You can use custom index values for the DataFrame by adding a parameter to the pd.DataFrame function. Set the optional index parameter of the pd.DataFrame function to an array of strings for the index values.
In the same way that we just defined the index values, you can also define the column names separately. Set the optional columns parameter of the pd.DataFrame function to an array of strings for the column values.
Notice that the row values are now defined as a list of lists rather than a dictionary of lists. This is because the column values are no longer being defined with them.
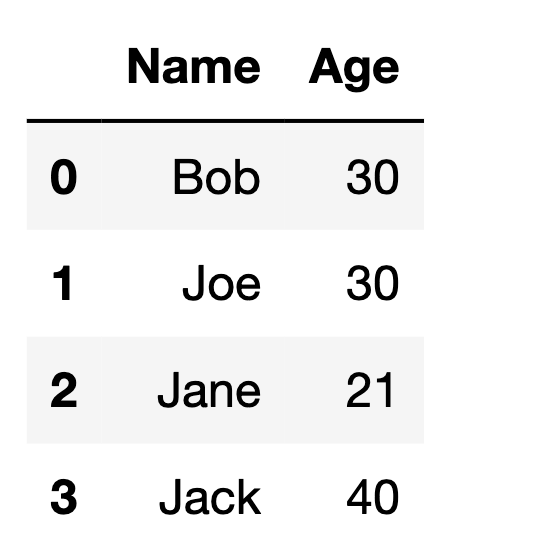
Method #3: Creating DataFrame using zip() function.
The zip function returns an iterator of tuples where the corresponding items in each passed iterator is paired together. By calling the list function on the object returned from the zip function, we convert the object to a list which can be passed into the pd.DataFrame function.
name = ["Bob", "Sam", "Sally", "Sue"]
age = [19, 17, 51, 49]

data = list(zip(name, age))

df = pd.DataFrame(data,
                  columns = ['Name', 'Age'])

df